
Crypto technical analysis is a technique that traders use to forecast future movements of cryptocurrency based on prior historical data, more specifically price and volume. Although Technical Analysis (TA) has been used in traditional finance for a long time, the same rules work well for crypto too.
In fact, the fundamental aspect of technical analysis lies in tracking the price movements in relation to supply and demand and making trades. It is primarily the analysis of the market and its behavior in terms of its price trend and then using that knowledge to act in accordance with its next move.
Technical Analysis vs. Fundamental Analysis
While Fundamental Analysis (FA) aims at estimating an asset’s intrinsic value by analyzing different aspects of it, including the technology behind it, its team, and the market in which it is to be sold, TA is all about the numbers. Technical analysis looks at charts and numerical data, focusing on “what” is happening to an asset’s price rather than “why” it happens.
Indicators such as moving averages, trendlines, and the Relative Strength Index (RSI) are used to make decisions in TA. While FA takes into account a broader aspect such as the practical use of a given cryptocurrency, community strength, and partnerships, TA is more focused on price action and patterns.
Core Principles of Technical Analysis
Technical analysis functions under a few fundamental principles:
- Price Movements Follow Trends: Prices don’t move randomly, they move in identifiable patterns.
- History Repeats Itself: Because traders often react to similar market conditions a particular way, it becomes possible to predict future movements based on past behavior.
- Price Discounts Everything: TA strongly emphasizes price as the ultimate measure of value, without always considering the myriad factors that may influence it.
Charts used in Technical Analysis
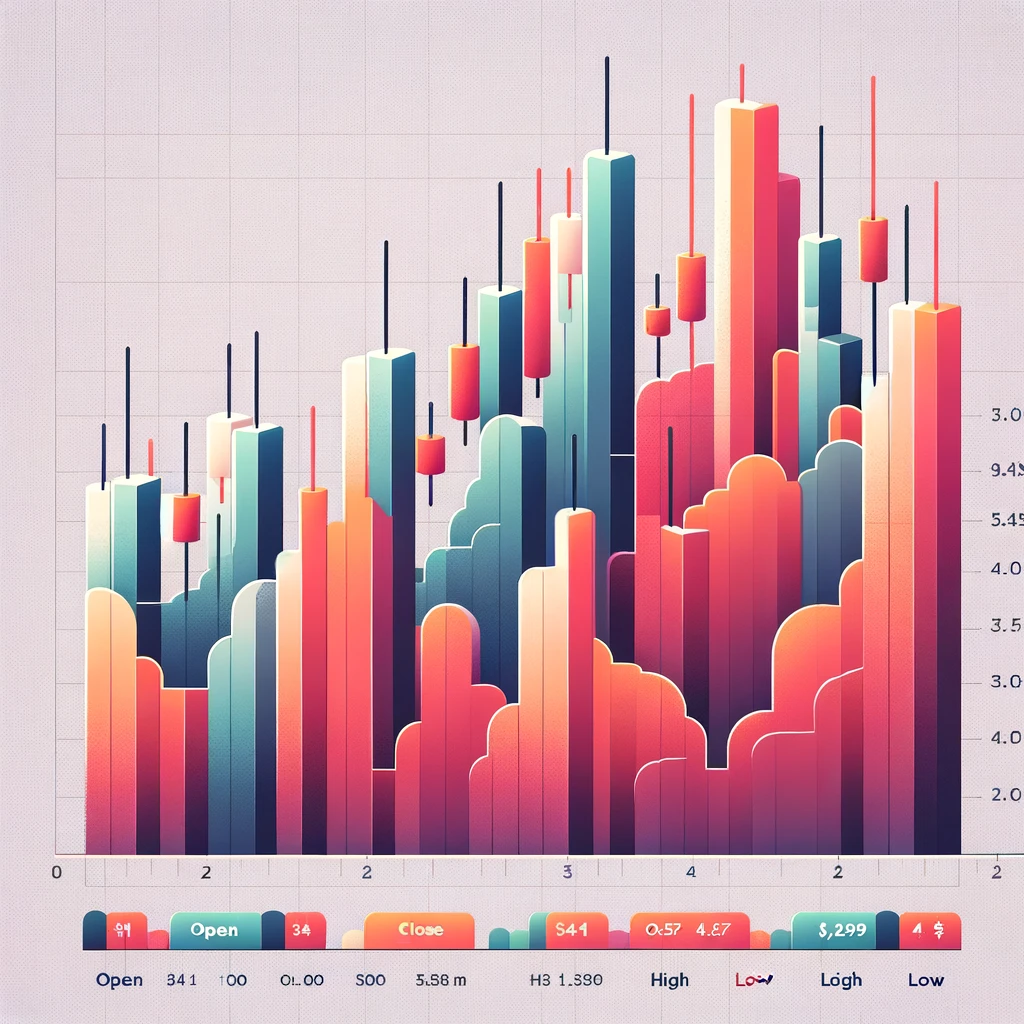
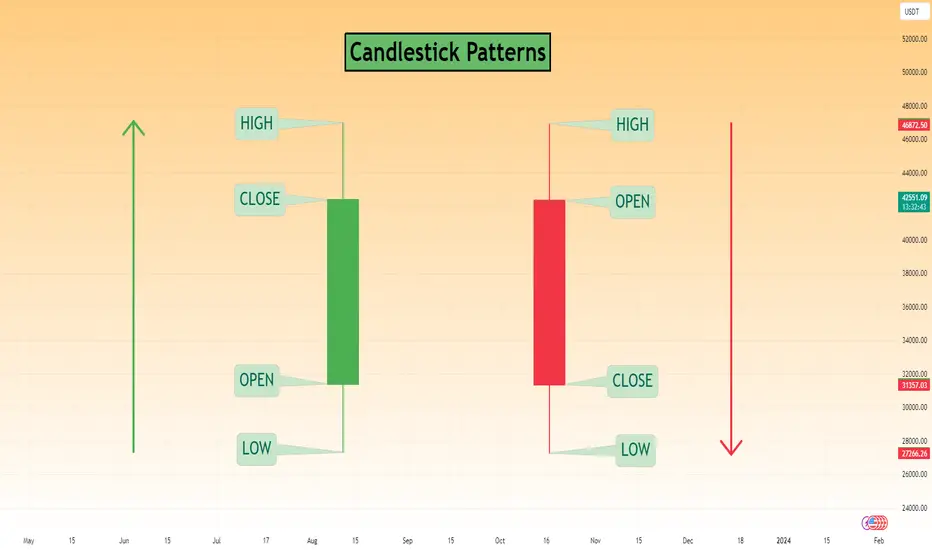
- Candlestick Charts: These depict the fluctuations of prices in a given time frame and can be useful for spotting trends.
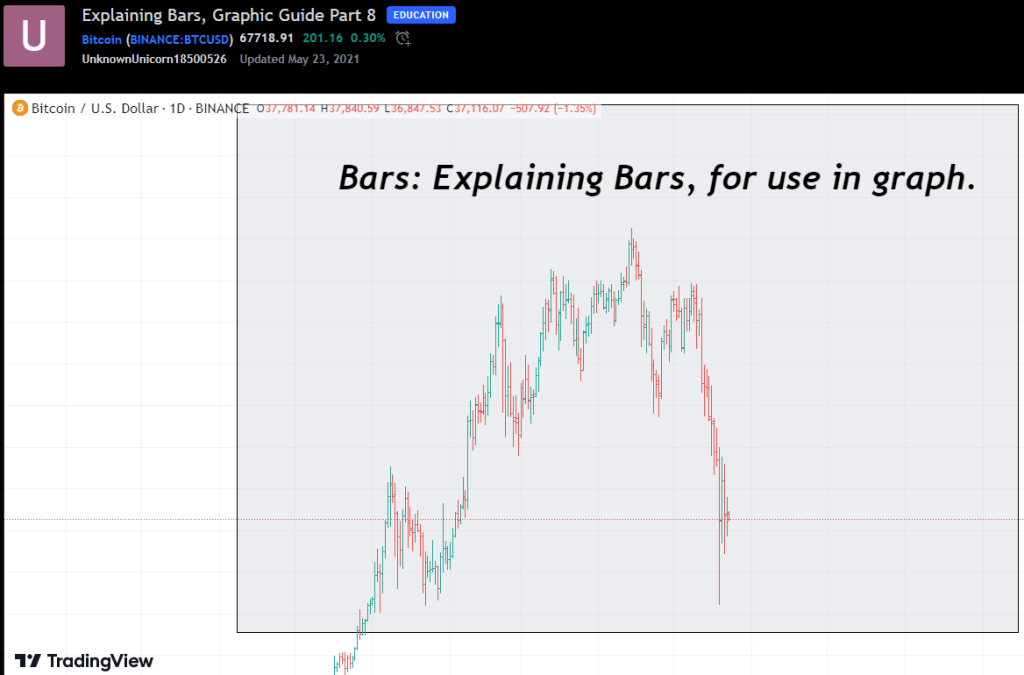
- Bar Charts: These reveal the same kind of data as candlestick charts but in different manner of presentation.
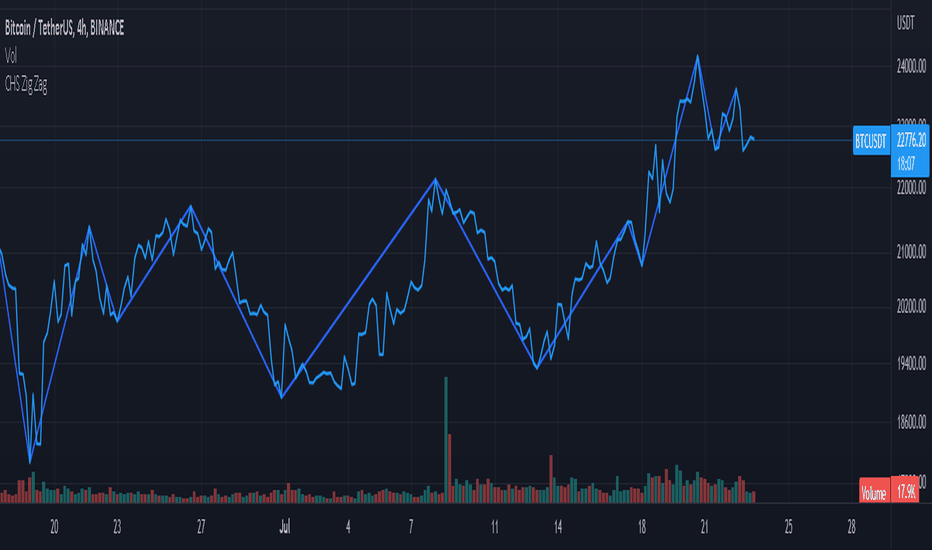
- Line Charts: These provide a clear view of the overall trend, by connecting closing prices over a set period.
Key Technical Indicators
TA uses numerous factors and technical indicators that originate from these cited charts (candlestick, bar and line charts). Some of the most common technical indicators are:
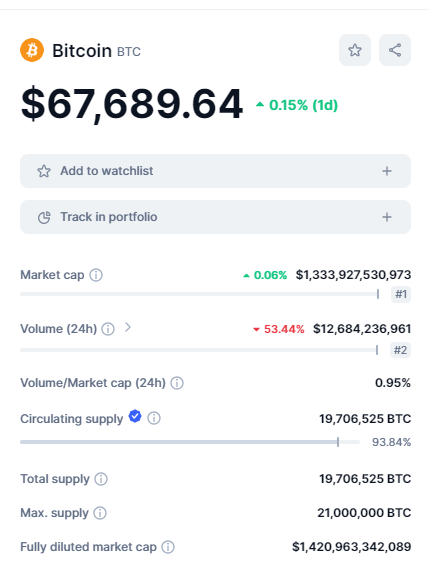
- Market Cap: Showcases a cryptocurrency’s stability and potential for growth by multiplying the current price by the total number of coins that exist in the market.
- Support & Resistance (SR): Price levels that act as barriers, preventing price fluctuations so that it does not move erratically.
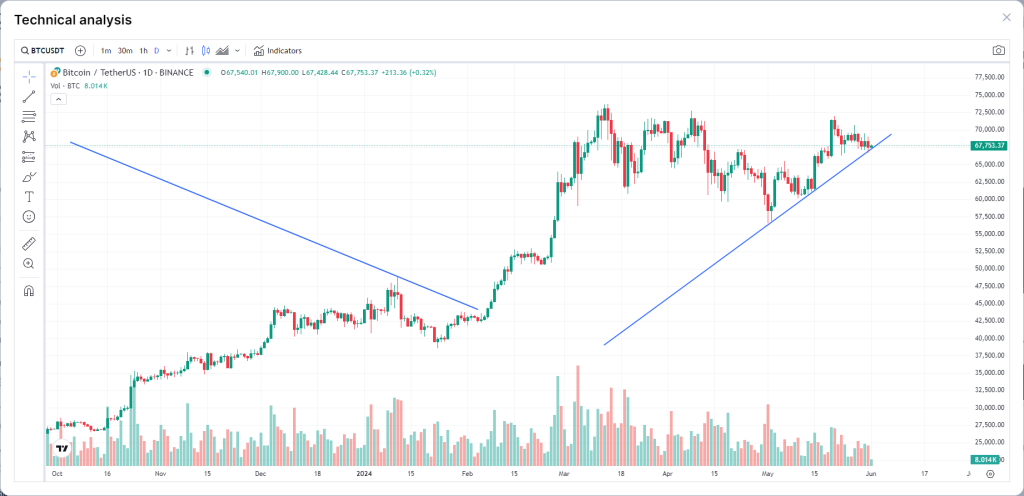
- Trend Lines: Lines drawn to give an indication of the general trend of the market, cutting through the noise of short-term volatility.
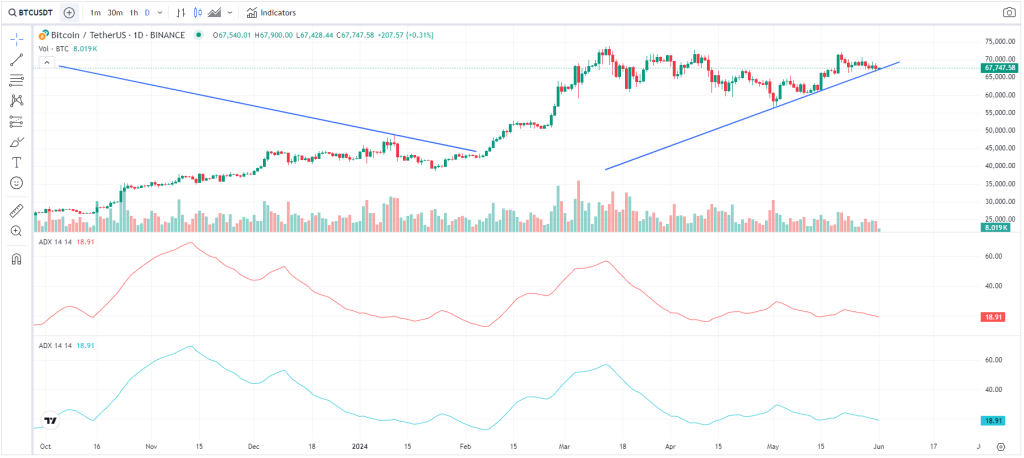
- Average Directional Index (ADX): They are used to determine the strength of a trend.
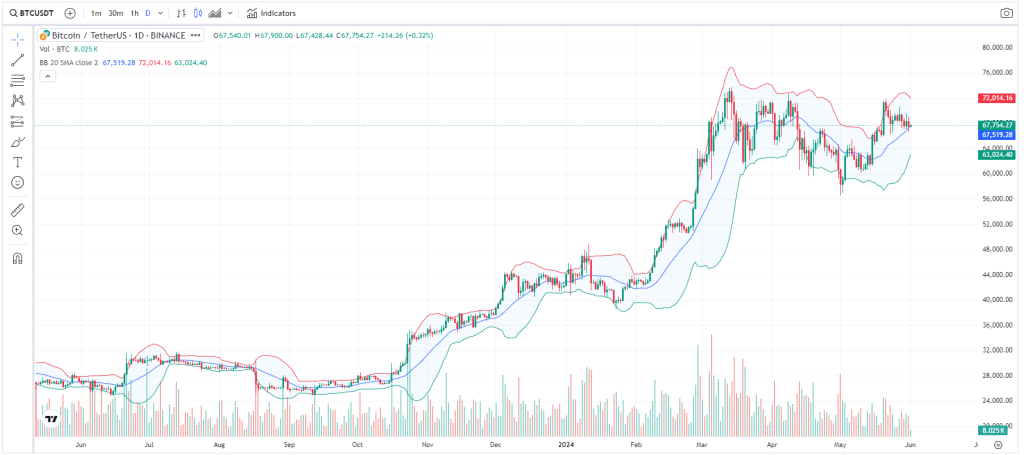
- Bollinger Bands (BB): These bands depict price fluctuation and will, therefore, inform the traders of the overbought and oversold situations.
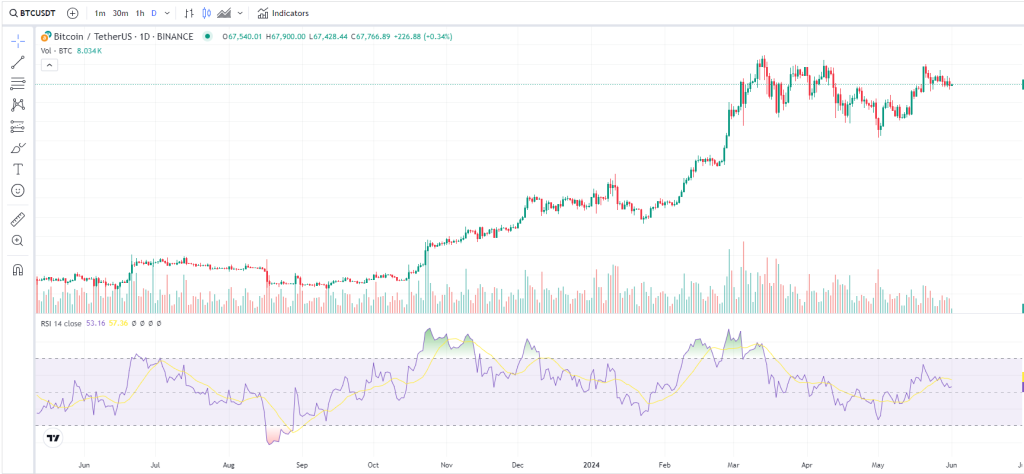
- Relative Strength Index (RSI): A momentum oscillator that measures the speed and change of price movements, revealing the level of overbought or oversold conditions.
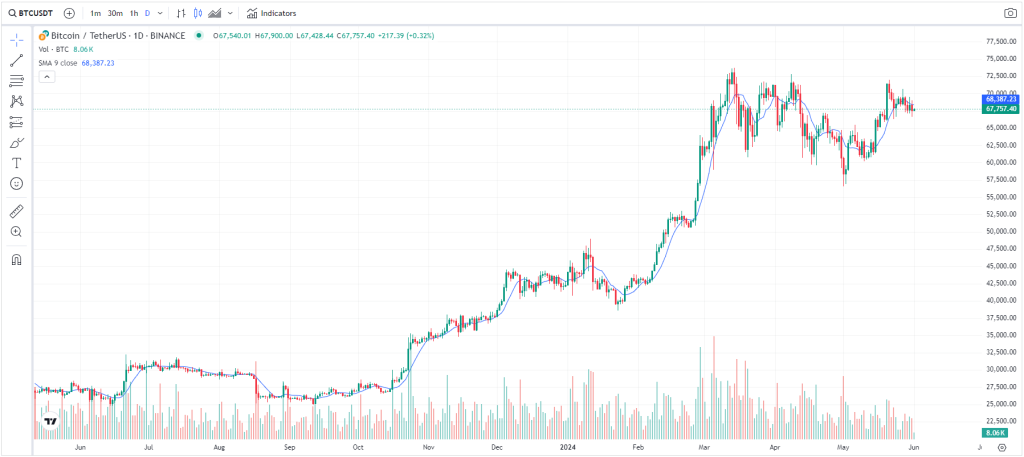
- Moving Average: Eliminates short term fluctuations in prices and reveal the long term trend in a given time span.
- Standard Deviation: Reflects the degree of variation in the asset’s value over time.
- Trading Volume: Reveals the amount of cryptocurrency traded, indicating the strength of a price move.
Technical Analysis for Beginners
- Start Small: Although trading might seem appealing, only trade with money that you are willing to lose. Everyone knows that people make errors all the time, and this is especially true during the learning process.
- Learn by Doing: Certainly, practical experience behind the wheel is much more effective than just reading or going through flashcards. To get some hands-on experience, you can dive in with a small amount of capital.
- Incorporate Fundamentals: By utilizing both TA and FA it is much easier to have a clearer picture of the markets.
- Broaden Your Analysis: This way it is possible to employ multiple strategies and multiple indicators which would allow for greater reliability of the predictions.
What Are Some Characteristics Of A Good Technical Trader
A good technical trader is subtle and formal, so he tends to make decisions based on the use of charts and indicators more than impulses or feelings. Specialists in trading do not speculate; they base their trades on careful analysis. They also stay away from overcomplicating their strategy with too many indicators, which can lead to confusion.
Trading should not be based on emotions. Nail down your strategy and don’t chase losses by removing stop losses. It is important to take profits at designated levels, for greed is the enemy of success once the portfolio is already in the green.
Conclusion
Although technical analysis is very useful in gaining insight into stock prices for the purpose of trading, it isn’t perfect. It is most effective when used in conjunction with other forms of analysis. Always trade systematically, place and exit trades based on your analysis, not due to impulse. Remember, this isn’t a gamble; generally, it requires hard work and more than anything it needs a definite strategy to work.