To kick off your journey into the forex industry you need to understand the basics of technical analysis, which comprises of different components as outlined below.
Course Outline
Grade 1
Support and Resistance Levels
Grade 2
Japanese Candlesticks
Grade 3
Fibonacci
Grade 4
Moving Averages
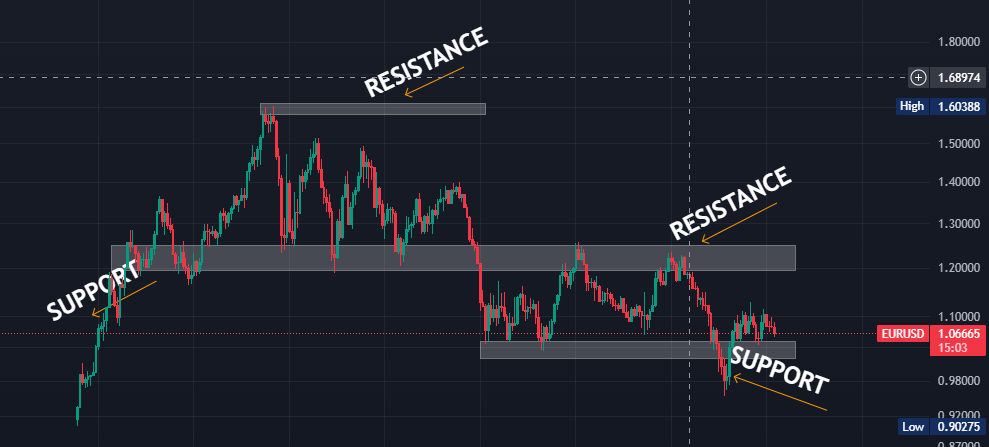
1 Support and Resistance Levels
In forex trading, support and resistance levels are key concepts used to identify price levels where the market tends to react.
- Support Levels: The market has historically found these price levels difficult to fall below. They act as floors for the price as the name implies, where buying interest is typically strong enough to prevent further downward movement.
- Resistance Levels: On the other hand, resistance levels are price levels where the market has historically struggled to rise above. They act as ceilings for the price, where selling pressure is typically strong enough to prevent further upward movement.
Example

Traders use support and resistance levels to make trading decisions, such as identifying potential entry and exit points, setting stop-loss orders, and gauging the strength of price movements.
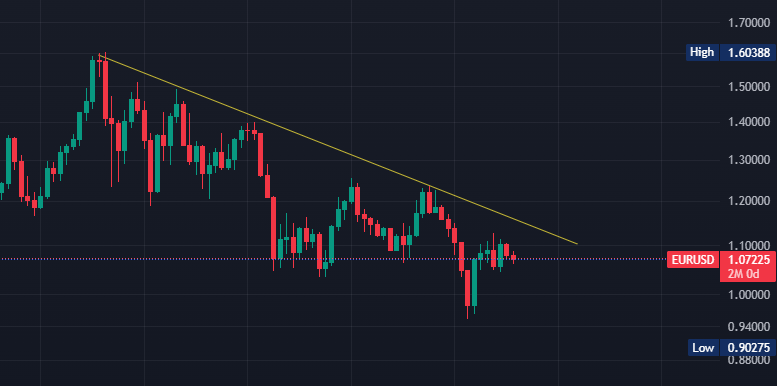
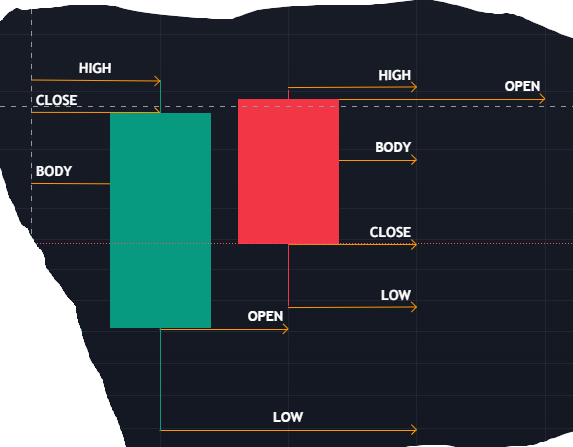
2 Japanese Candlesticks
Japanese candlesticks are a popular charting method in forex trading. Each candlestick represents the open, high, low, and close prices for a specific period. Traders use candlestick patterns to analyze market sentiment and forecast future price movements.
For example, we have two commonly used colors of candles: green and red. A green candlestick indicates that the closing price was higher than the opening price, while a red candlestick indicates the opposite (green indicates an upward movement, while red indicates a downward movement).
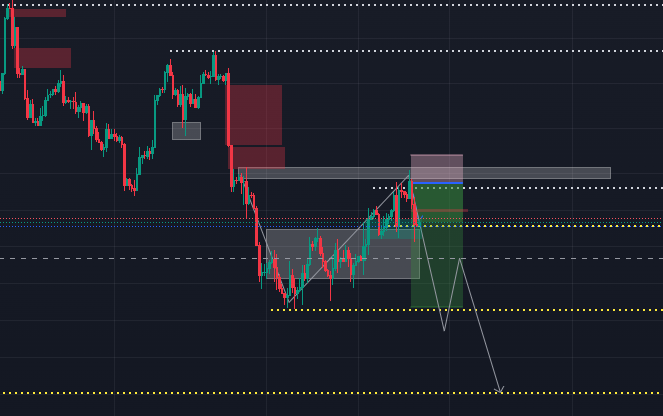
Fibonacci
Fibonacci, a mathematical sequence, is applied in forex trading to identify potential support and resistance levels. These levels, based on ratios like 0.5%, 0.6%, 0.7%, etc, are sometimes known as equilibrium zone and discount zone, indicating significant areas for price reversals or continuations. Traders use Fibonacci retracement alongside other tools to make informed trading decisions and spot entry and exit points.
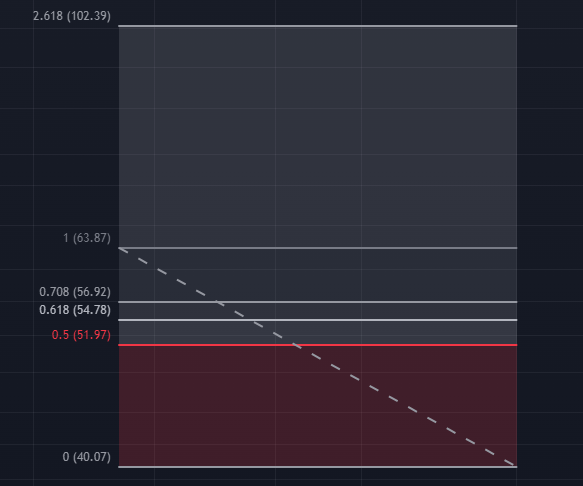
There are no specific settings for the Fibonacci, as a trader you configure it to match your trading plan on what you wish to see.
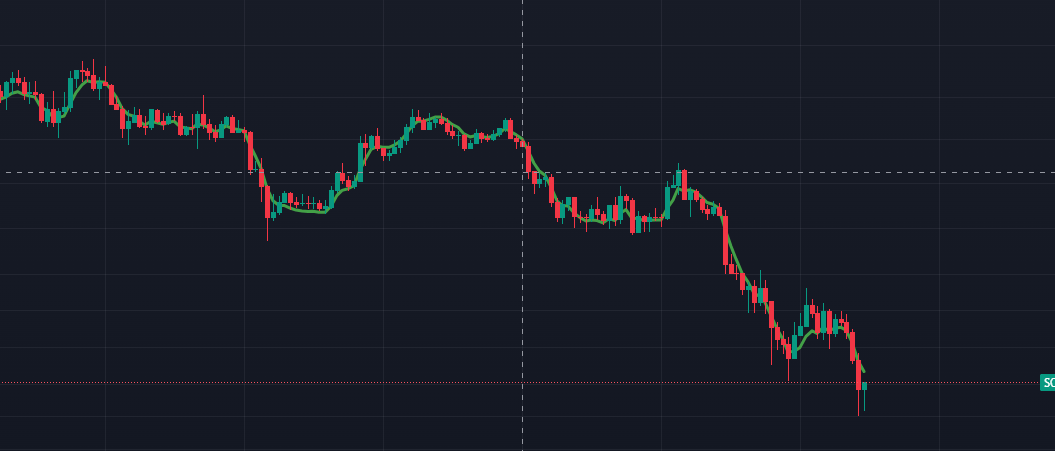
Moving Averages
Moving averages are key technical indicators in forex trading, smoothing out price data to show trends over time. Traders use them to gauge the direction of the trend and identify potential support and resistance levels. There are two main types: simple moving averages (SMA) and exponential moving averages (EMA), each providing different insights into price movements. By analyzing moving average crossovers and divergences, traders can make informed decisions about when to enter or exit trades.
The most common types of moving averages used in forex trading are:
- Simple Moving Average (SMA)
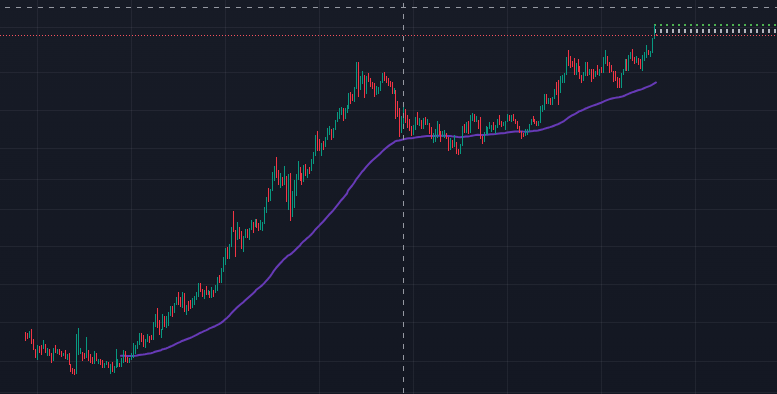
- Exponential Moving Average (EMA)

Stay tuned for next chapter.
Disclaimer: Forex trading carries risk and may not be suitable for all investors. Past performance is not indicative of future results. Consider your financial situation and risk tolerance before trading. Consult a financial advisor for advice. Only trade with funds you can afford to lose.